- Updated:
- Published:
The fastest-growing iGaming markets since 2023 are not just annual winners
Three years of Blask demand data show which markets kept compounding, and why the pattern behind sustained growth matters more than a single annual ranking.
Fast growth in one year is easy to find. A market can double off a low base, appear in a ranking, and plateau. The harder question is which markets kept compounding.
Blask has tracked iGaming demand across more than 120 countries since 2023. Comparing the same calendar window, January through April, across three consecutive years gives a cleaner signal than a single year-over-year snapshot: which markets were already active in 2023, and how much has demand grown since?
The answer points to three markets in sub-Saharan Africa where demand, brand count, and commercial opportunity all expanded together: Malawi, the Democratic Republic of the Congo, and Rwanda. Each has a different story. All three share the same underlying pattern.
What Blask measures
Blask Index is an AI-enhanced demand signal built from search activity across iGaming brands. It measures player interest before it converts to bets or revenue, making it a leading indicator of where commercial opportunity is building.
For commercial sizing, Blask calculates Acquisition Power Score (APS) and Competitive Earning Baseline (CEB). APS estimates how many new customers a market should be attracting based on current demand. CEB estimates the revenue available under current competitive conditions.
Both are shown as min–avg–max ranges. Acquisition and revenue depend on season, campaign timing, and competitive intensity. The range shows the realistic floor and ceiling; the average is the most likely scenario under current conditions.
Three years of compounding demand: the same-window comparison
The table below compares Blask Index for January–April in 2023 and 2026. Using the same calendar window removes seasonal distortion and isolates structural growth from short-term spikes.
| Market | Jan–Apr 2023 | Jan–Apr 2026 | Growth | Active brands |
|---|---|---|---|---|
| Malawi | 9.53M | 29.58M | +210% | 22 → 30 |
| DRC | 28.43M | 81.53M | +187% | 25 → 33 |
| Rwanda | 5.91M | 15.74M | +166% | 15 → 19 |
| Togo | 237.9K | 616.1K | +159% | 16 → 20 |
The three frontrunners share two characteristics that distinguish them from one-year outliers: demand grew across the full period without reverting, and the number of active brands expanded alongside it. More competition and higher overall demand moving in the same direction is a structural signal, not a seasonal effect.
Malawi: the clearest case of sustained growth
Malawi’s Blask Index more than tripled from 9.53M to 29.58M across the Jan–Apr comparison window, while active brands grew from 22 to 30. The market currently generates 1.04M average APS (774.8K–1.82M range) and $5.75M average CEB ($4.3M–$10.1M range) across January–April 2026. betPawa leads by demand, with Betway and Premier Bet in second and third.
Two structural drivers explain why this growth compounded rather than spiked.
The first is regulatory clarity. Malawi’s Gaming and Lotteries Authority (MAGLA), formed in 2022 from the merger of the Gaming Board and National Lotteries Board, published new advertising and marketing regulations in 2025 and moved to enforce licensing requirements against unlicensed operators. More structure in a market means operators with proper licensing face less competitive distortion from unregulated alternatives.
The second is payment access. Mobile money handles the majority of deposits and withdrawals across Malawi’s betting market, and online betting now accounts for an estimated 80% of gross gaming revenue in the country. A market where players can fund accounts in seconds from a feature phone has a structural access advantage over one that still depends on cash or bank transfers.
These two factors, a formalizing regulatory layer and mobile-first payment access, lower the friction that typically prevents demand from converting to acquisition at scale.
The DRC: the largest compounding story by scale
The Democratic Republic of the Congo is the biggest market in this group by absolute demand. Blask Index grew from 28.43M to 81.53M across the Jan–Apr comparison, nearly tripling while active brands increased from 25 to 33.
The current commercial picture reflects that scale. The DRC generated 2.55M average APS (1.76M–4.93M range) and $37.1M average CEB ($25.2M–$73M range) in January–April 2026. betPawa leads by demand, with NgeNge and Winner Bet competing for the second position.
The growth mechanism here is mobile money. As iGaming AFRIKA reported in January 2026, platforms like M-Pesa, Airtel Money, and Orange Money handle most betting transactions in the DRC, giving operators access to players outside the traditional banking system. In a country of 115 million people where most digital financial activity runs through mobile wallets, that reach is significant.
The context also includes a regulatory gap. The DRC’s iGaming market operates under the oversight of the national lottery authority, and a dedicated gaming regulator is still being developed. That means less formal compliance pressure for operators today, but also weaker player protection frameworks and limited official revenue data. The GSMA estimates that mobile internet users in Africa reached 416 million in 2024, with 80% of connections projected to be on 4G or 5G by 2030. The DRC sits inside that expansion curve with a young population and accelerating digital adoption.
This combination, large population, mobile-first economy, growing brand count, and early-stage regulation, is what makes the DRC the highest-ceiling market in the current compounding cohort. It also makes it the one that requires the most careful due diligence before entry.
Rwanda: from annual ranking to durable signal
Rwanda led the 2024 annual ranking with over 146% year-over-year growth. The three-year window adds depth to that picture.
From January–April 2023 to January–April 2026, Rwanda’s Blask Index grew from 5.91M to 15.74M, up 166%, while active brands increased from 15 to 19. The current market generates 623.6K average APS (466K–1.10M range) and $9.58M average CEB ($7.17M–$16.83M range). betPawa holds dominant market share, with Winner (AFR) and Gorilla Games in second and third.
Rwanda’s regulatory environment shifted materially in 2024. A Prime Minister’s order signed in June 2024 transferred gaming oversight from the Ministry of Trade to the Rwanda Development Board, alongside a comprehensive gambling policy review covering licensing standards, taxation, player protection, and real-time digital monitoring. In August 2025, Rwanda officially reopened the licensing process for casino and sports betting operators as part of the new policy implementation.
For operators, a market transitioning from ministry oversight to a dedicated regulatory authority signals something specific: the government sees iGaming as a sector worth formalizing, not restricting. That is different from a crackdown, and different from benign neglect.
Rwanda’s market is more concentrated than Malawi’s or the DRC’s. betPawa holds a commanding share, which limits near-term disruption from new entrants. The opportunity for new operators is in the space betPawa does not fully cover: product verticals, player segments, or distribution channels where the dominant brand has left gaps.
Why percentage growth alone can mislead
Togo grew 159% across the same comparison window. That rate sits alongside the compounding markets in this analysis. The absolute context changes the interpretation.
Togo’s Blask Index moved from 237.9K to 616.1K. The market currently generates 37.3K average APS (18.7K–93.3K range) and $448K average CEB ($224K–$1.12M range). That is genuine growth. It is also commercially smaller than Malawi, the DRC, or Rwanda by an order of magnitude.
This is the limitation of annual percentage rankings as a standalone signal. A market can double from a small base and appear impressive in a leaderboard while remaining one-tenth the commercial size of a market growing at a slower absolute rate. The question that matters for operators is not which market grew fastest in percentage terms, but which markets are large enough to justify resource commitment, growing fast enough to act on, and structurally positioned to keep growing.
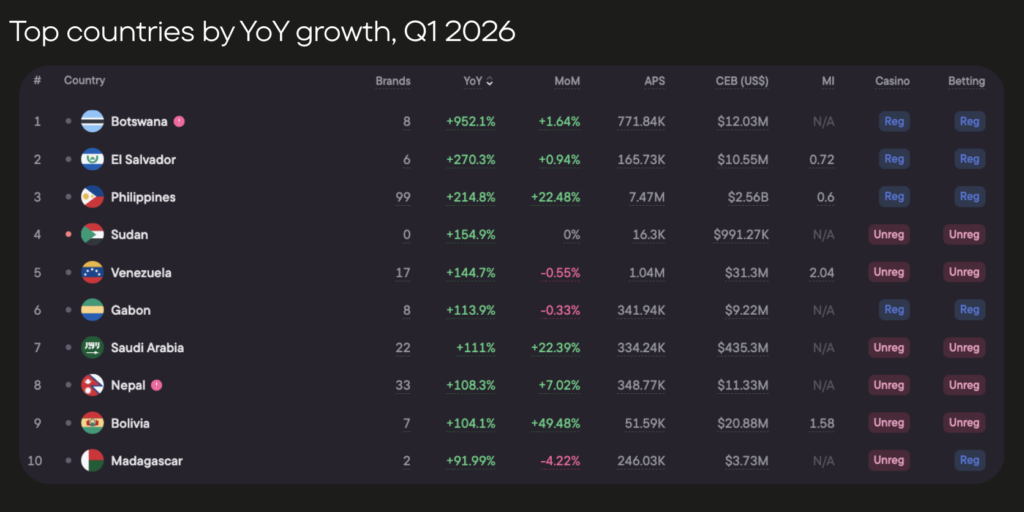
The Philippines offers a different version of the same lesson. It appeared in Blask’s 2024 ranking after a sharp demand rise, but Blask data showed at the time that demand spiked within the year and then declined back toward earlier levels. That is a different pattern from the three-year compounding visible in Malawi, the DRC, or Rwanda. Spikes can produce a strong annual number. They do not produce durable market positions.
What operators should track in growing markets
Growth markets move through stages. Demand rises before commercial infrastructure catches up. The data signals that matter are different at each stage.
| What to track | Why it matters |
|---|---|
| Blask Index trend | Is demand still growing, or has it plateaued? |
| Active brand count | Is competition expanding alongside demand? |
| BAP distribution | Is demand spreading across brands, or locked into one? |
| APS and CEB ranges | Is the market commercially meaningful at current scale? |
| Regulatory status | Is the market becoming more structured, or stagnating? |
Malawi, the DRC, and Rwanda all show positive signals across most of these dimensions right now. Brand count is still expanding. APS and CEB are at levels that justify commercial attention. The regulatory direction in all three is toward more structure, not away from it. And the demand trajectory from 2023 to 2026 has not reversed.
That is the compound signal. Not a single year’s percentage, but a multi-year pattern that has not broken.
Conclusion: track growth while it is still moving
Annual rankings are useful. They create entry points and signal when to pay attention. They go stale within months.
The markets worth prioritizing are the ones where demand kept compounding after the first spike. From the current Blask data, that is Malawi, the DRC, and Rwanda. They were in the 2024 rankings. Three years later, the pattern still holds.
Operators waiting for the next year-end report before acting will find these markets more competitive than they are today.

Don’t wait a whole year for our next digest featuring the top 5 countries; instead, track all iGaming trends daily, or even hourly, by yourself.